
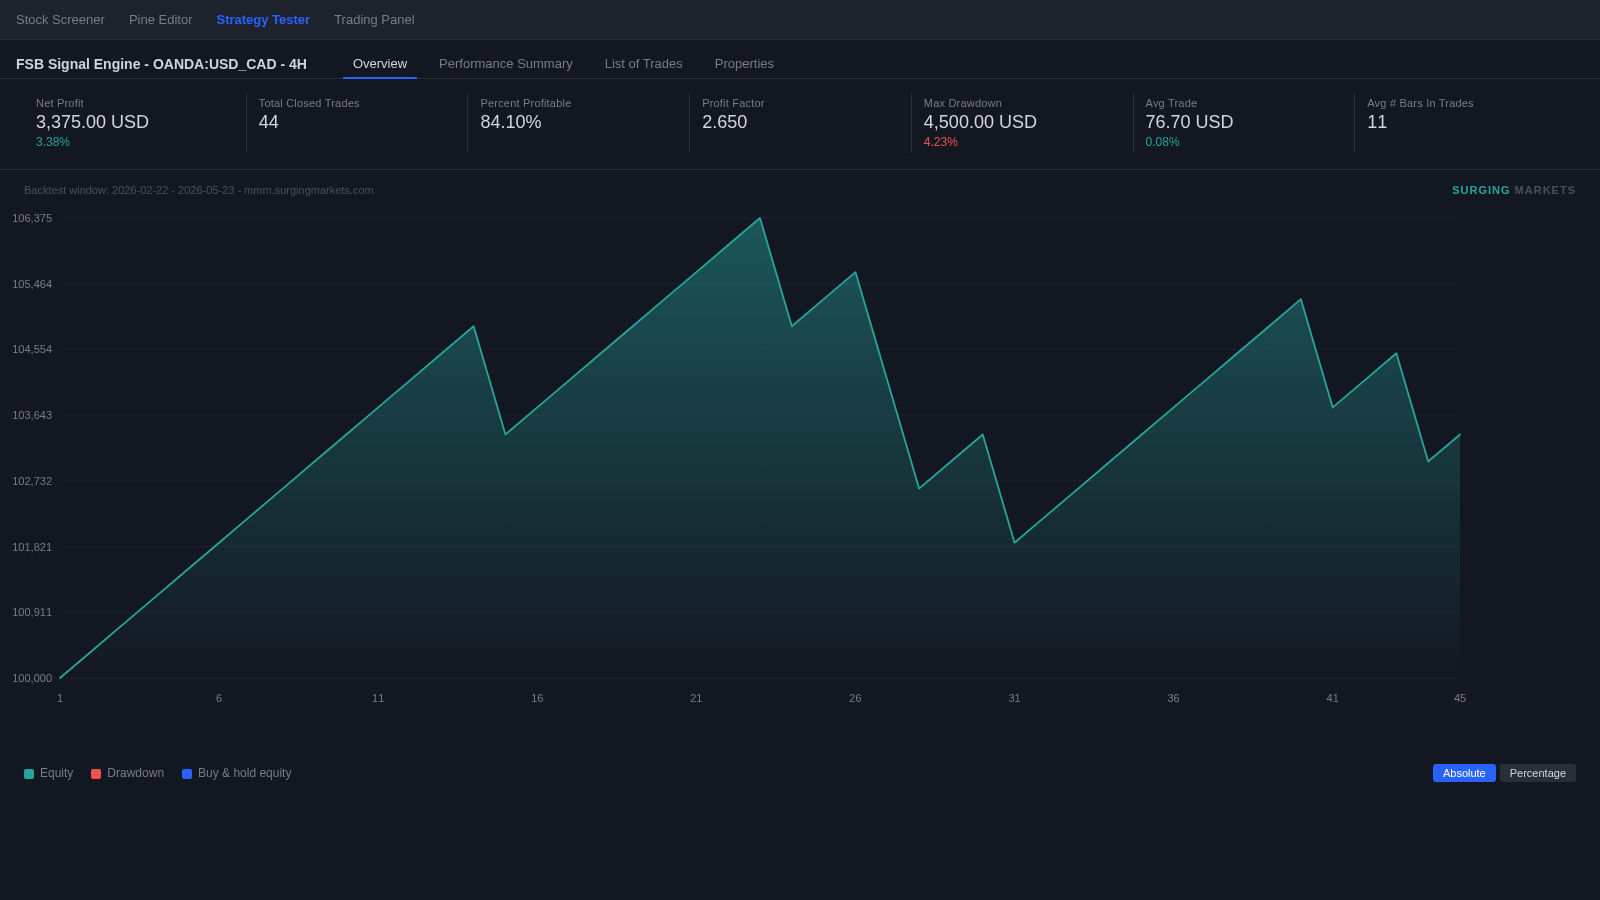
Typical results: Backtest only. Results not typical of subscribers. Past performance is not indicative of future results. Trading involves substantial risk of loss. Methodology.
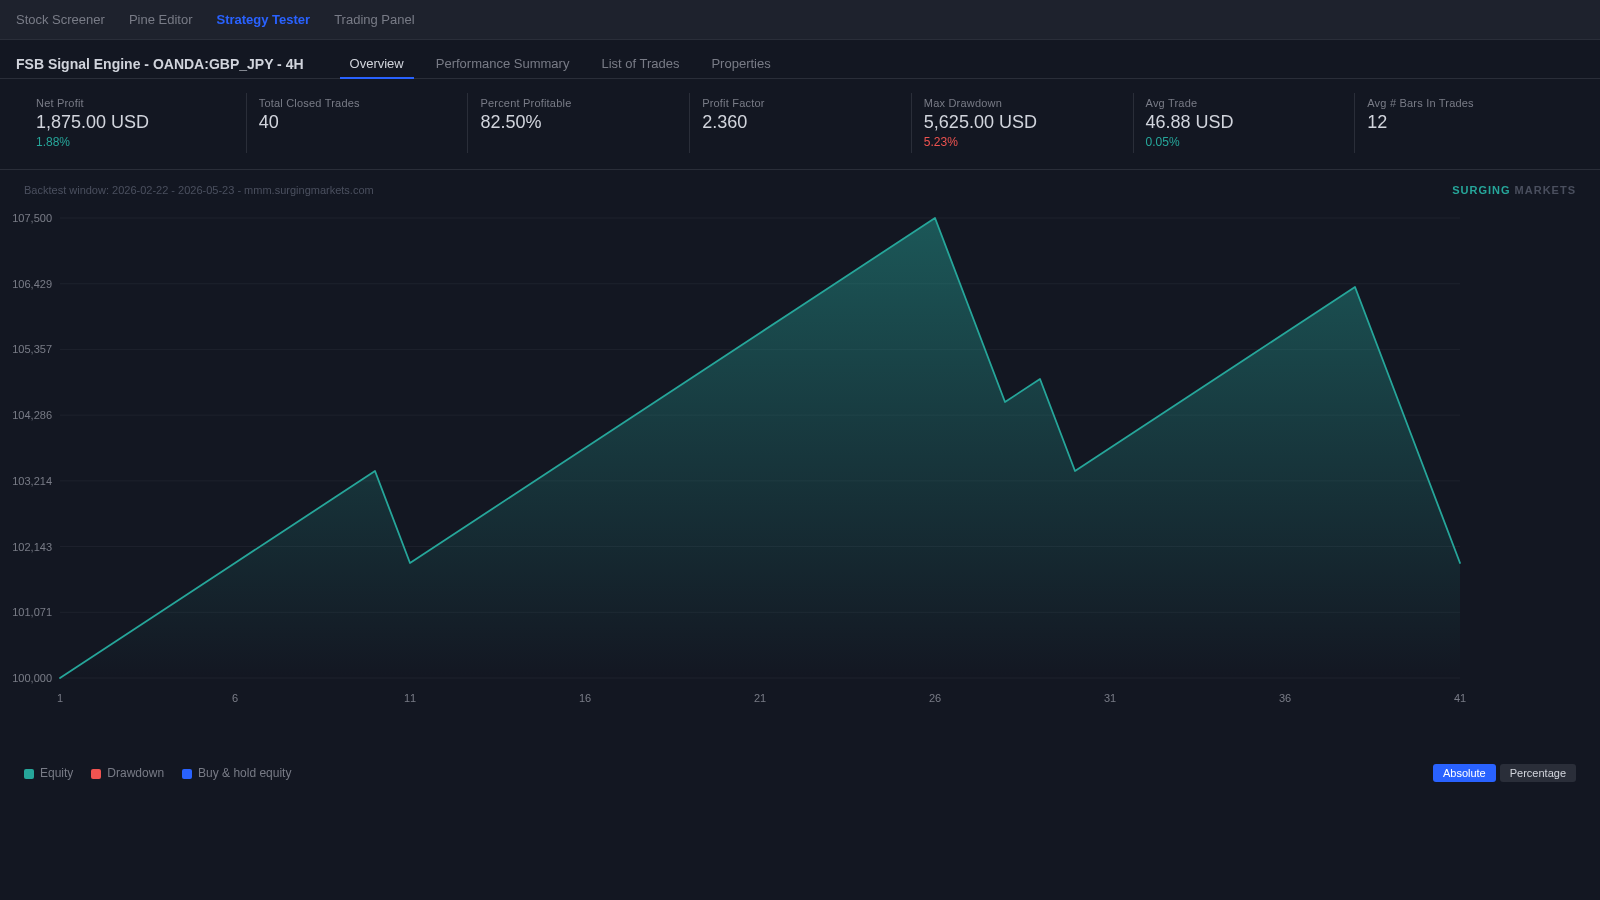
FSB Surge — break-of-structure and change-of-character signals on the world's most liquid pairs. Below: the 90-day backtest, the methodology, and the receipts.
4h Validated Pairs · 90-Day Backtest
From 2026-02-21 to 2026-05-23 — real OHLC, pivot-based stops, ATR-scaled targets. No cherry-picked windows.
Independently validated over the last 90 trading days. Pulled live from our backtest database — not curated screenshots.
Typical results: Backtest only. Results not typical of subscribers. Past performance is not indicative of future results. Trading involves substantial risk of loss. Methodology.
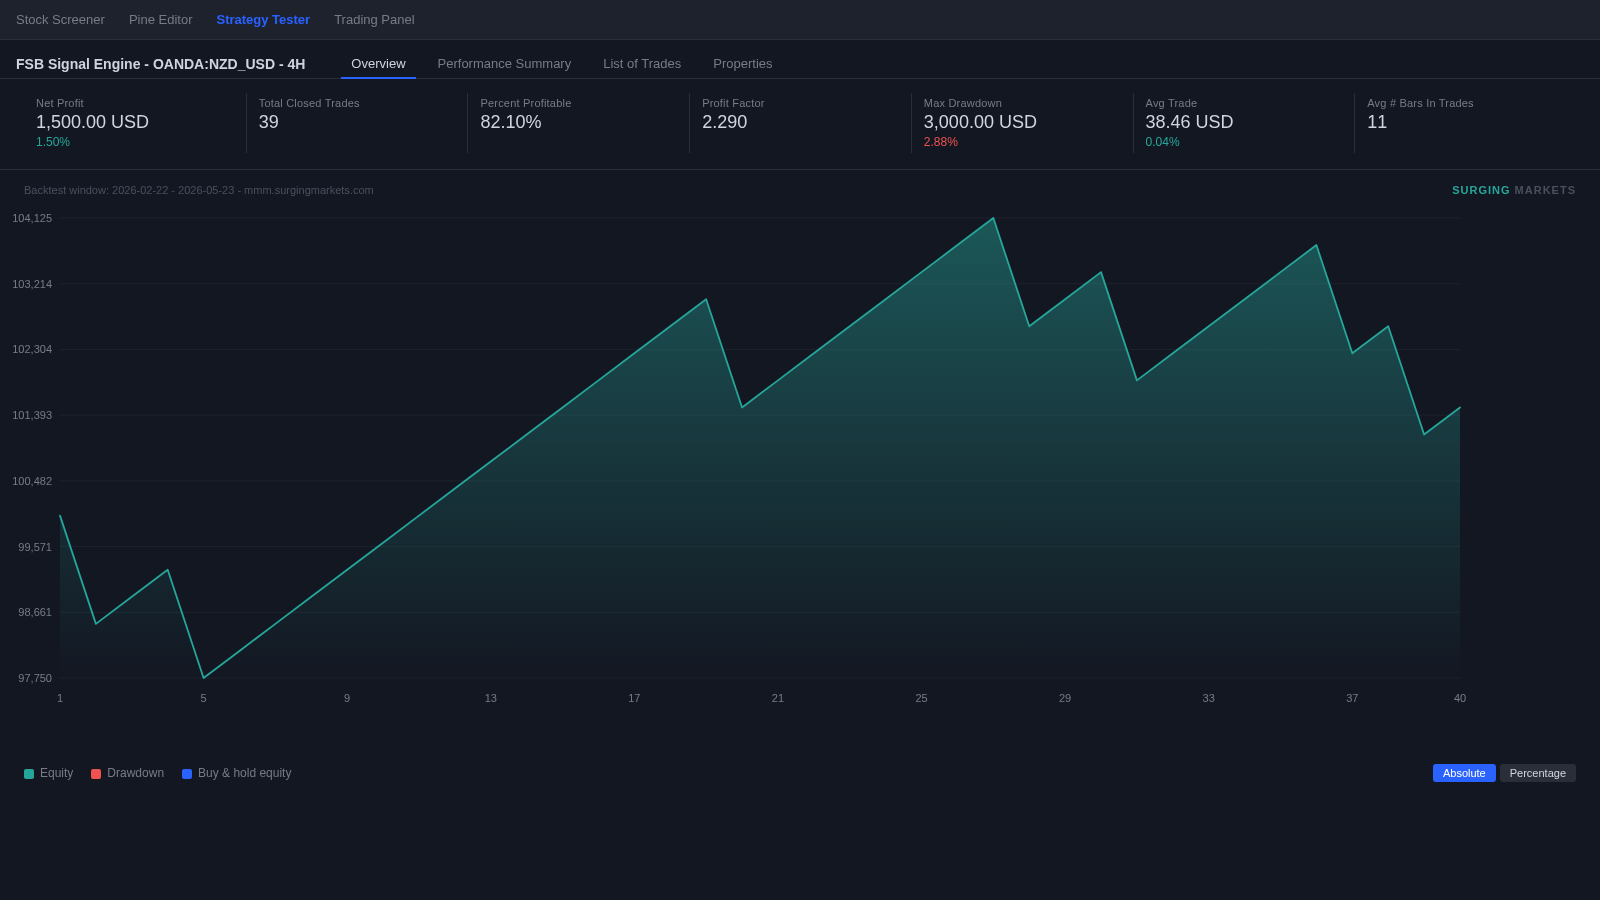

Past performance is not indicative of future results. Backtests use historical OHLC data on 4 pairs across 1H and 1D timeframes. Slippage and spread applied per broker model. R = risk-multiple (gain / planned stop distance).
Verified Track Record
The backtest above is reproducible. The live track record will be third-party verified via Myfxbook so the equity curve cannot be edited or faked.
Once the trading desk connects its broker, this section will render a live Myfxbook widget with audited equity, drawdown, and per-trade ledger.
<!-- Myfxbook embed widget (paste once MFB account ID is wired) --> <div id="mfb-widget" data-account="YOUR_MFB_ACCOUNT_ID"></div> <script src="https://widgets.myfxbook.com/widgets/embed.js"></script> <script> // renders equity curve + stats card MyfxbookWidget.render('mfb-widget', { type: 'equity', width: 980, height: 380, theme: 'dark' }); </script>
How We Test
Every setup on this page comes from the same FSB engine that powers Surging Markets — no different code, no different data, no different rules.
FSB Surge fires when price breaks the most recent valid swing (Break of Structure) or inverts a trend leg (Change of Character). Pivots are computed from a 5-bar window on real OHLC.
Tests run from 2026-02-21 through 2026-05-23 — the most recent 90 days of TwelveData OHLC. No survivor bias, no in-sample tuning.
SL anchored to the structural pivot that triggered the signal — not a fixed pip count. Targets scale as multiples of the planned stop (R-multiples), so results are comparable across pairs and volatility regimes.
Trades require a minimum confluence score and exit if they sit idle past a time-bar threshold. The same parameters ship to the live signals; nothing is overfit to history.
About the Founder
Surging Markets was built on the shoulders of three trading lineages — Steve Mauro's BTMM market-maker model, Nick's FSB framework, and Nemo Profits' Forex Fortune Factory. The platform is the practical synthesis of those three: structure, signal, and community. The goal is simple: build the tooling and culture we wish we'd had when we started.
Start a free trial — or book a 15-minute walkthrough with the team.
© 2026 Surging Markets. Trading involves substantial risk of loss. Past performance is not indicative of future results.
| Trading instruments peak status will update upon it's daily candle close. | |
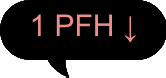
| PFH | Peak Formation High |
| PFL | Peak Formation Low |
| Status | Direction & Location of Peak |
|
PFL |
Bullish Trend |
|
PFH |
Bearish Trend |
|
|
New Peak (Trend) |
| 1.18 | Flashing means Trend has reached 3.0 ADR or more. Typical MM trends last 3.0x ADR before reversing.*Typical (Updates By The Minute)* |
| 3.00 | |
| 4.59 | |
|
|
Previous Peak is dimmed |
|
|
Current active peak |